Kick-off Zichtbaar slimmer
26-04-2018

On the 26th of April, we celebrated the kick-off of the project Revealing design: Data physicalisation for 21st century skills -with critical making and pie!
Introduction to the project
In this KIEM project the Amsterdam University of Applied Sciences, St Jan School and Waag Society aim to uncover the potential of data physicalisation -making tangible representations of data and abstract information- in education.
Data physicalisation goes one step further than data visualisation in that it deals with designing and creating tangible representations of data, for sharing and discussing knowledge.
The goal of the project Revealing design (“Zichtbaar slimmer”) is to do practice-based research into the potential of data physicalisation –making data tangible– as a vehicle to support data literacy. The main question is: What is the potential value of data physicalisation in education?
Mapping the challenges of data physicalisation
The session started with pie putting all the project partners on the map. This was followed by an explanation of the general outlines of the project, illustrated by some of the most remarkable examples in this field. Some interesting collections can be found on Instagram here and on Dataphys.

There is a long history of making data and abstract information physical. For example, an abacus and pies for explaining fractions are illustrations of physical visualisations used to increase understanding of mathematical concepts. Nowadays, data is being collected, shared and used at exponential scale. However, this does not necessary and directly lead to more knowledge and skills. Adding to this is that data systems are often complex and hidden away. The majority of the current visualisations are still static and two-dimensional. However, novel technological developments, such as digital fabrication and IOT offer the potential to make data systems more physical, tangible and interactive. Through the means of data physicalisation, the project goal is to find handles that enable us to embrace and shape these developments.
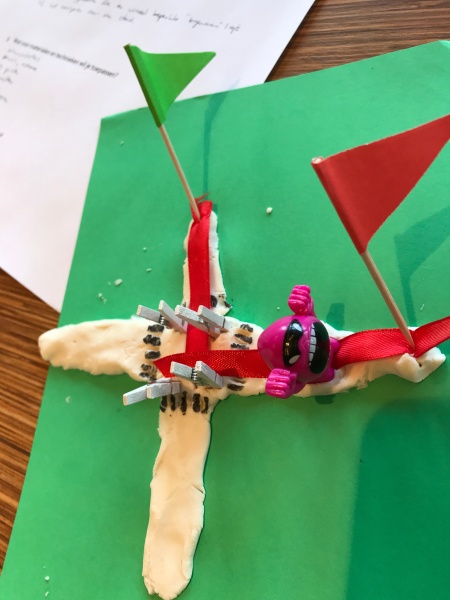
Creating physical representations hands-on
During the kick-off, the project members actively explored which questions are important when investigating and creating physical representations of data for 21st century skills -hands-on. The project themes and goals were actively constructed during a creative physicalisation session. Eight people participated in this session with backgrounds and experience in the field of physical computing, big / open data, information visualisation and maker education. During this workshop, held in the open space next to the Makers (fab)lab, the participants actively dealed with transforming text and thoughts into tangible and physical forms for discussion and understanding.
The participants were first asked to first write their responses to a couple of questions and were then asked to physicalize these answers. This led to a number of interesting insights.

The data cases that the people asked found worthy of exploration were:
- The state of the city (wayfinding, greenery, logistics, CCTV camera's, air quality...)
- Personal data (you in relationship to others)
- Audio data
- Abstract notions and sayings
- Digital literacy
- Trash, Food, Environment, Health
Some had specific user groups in mind (visually impaired, students, pupils). Cases responding to the direct experiences, perceptions and/or living environment of the user, namely the state of the city, seemed to be most prominent. "Make the invisible visible" turned out to be another important drive for the project.
What kind of materials and techniques would you like to use?
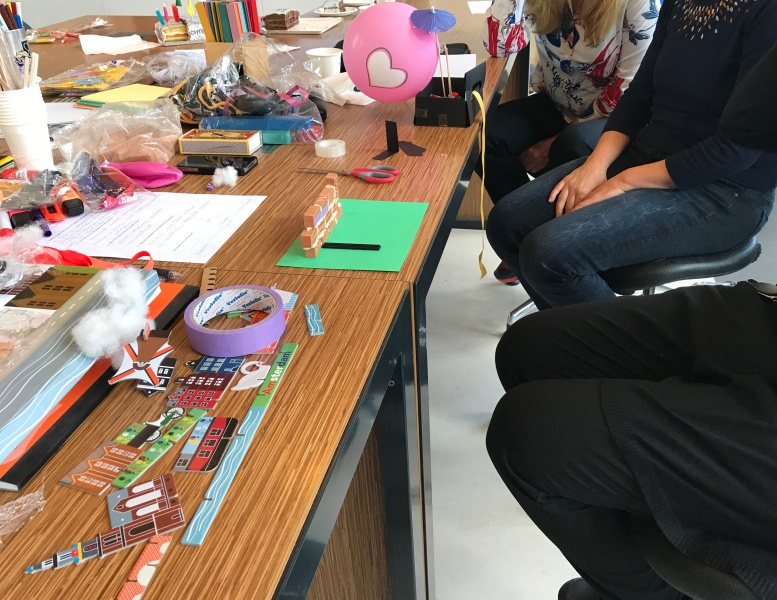
During the short dataphys session, different kinds of materials were placed on a pile for the participants to use. The chosen materials such as (craft paper, kapla, Lego bricks, wooden sticks, wool, plastic cups) were based on the experiences described in the paper in other previous Dataphys workshops (such as namely described in the paper Let’s get physical: Promoting data physicalization in Workshop formats by Yvonne Jansen et al, DIS, 2017). The diverse range of materials were also chosen based on properties such as being bendable, flexible and easy at hand. In addition, other material and tools such as a 3Doodler pen, pop-out city parts (Studio Roof), laser cut leftovers and just random material at hand (e.g. the Rainbow loomkit) were added to add some variety and explore what you may potentially do with waste and digital fabrication matter.
List of Materials and tools
Materials used also in other previous Dataphys workshops:
- Wooden blocks
- Small colored tokens
- Lego (also characters and tape)
- Wool
- Tooth-picks
- Elastic bands
- Plastic cups
- Cloth-pins
- Popsicle sticks
- Balloons
Extra material: Skewers, little umbrellas, ribbons, cake candles (zero and one shaped), pop-out city (Studio roof), cardboard easels, fabric sticker sheet, little bricks, figurines, Rainbow loomkit (rubber band craft) and leftovers from laser cutting.
Tools: The tools offered included rulers, tape, Stanley knife, markers, glue, colored craft paper, post-its, scissors and a 3Dooler pen.
 Participants wrote that they were keen on using materials that are:
- There at hand, simple, cheap, easily available (could also be recycled)
- Tangible, engaging to all different senses
- Transportable / Big (contrasting answers)
One rationale for making something big was that you would not be able to get around it. An interesting response was also the idea to use chemical materials and bio-techniques; materials that grow.

In terms of techniques, some participants wrote that they wanted to use the Fab lab / Digital fabrication tools (3D printing, Laser cutting). A prominent answer was the desire to use techniques for making the dataphysicalisation interactive (electronics, programming). Moreover, it was found crucial to use simple accessible techniques that would enable the target group (children) to create datahpys themselves as much as possible.
Interestingly, the textual responses did not entirely correspond to the materials and techniques that the participants chose for making their data physicalisation during the session. Namely, all the data physicalisations were very roughly the same size ±20x25cm), thus not that big. One participant used the available 3Doodler pen in an interactive dataphys demo.

All participants managed to make a ‘data’ physicalisation with the provided material at hand. The participants each used different materials from the pile provided, thus not showing an obvious common preference for only certain materials. Nobody used electronics, but none such material was instantly provided. Nobody also used the digital fabrication machines next to the workshop space, but the allocated time for this dataphys session was short. Thus future work should explore the potential added value of digital fabrication and more accessible ways to make bigger and interactive physicalisations.
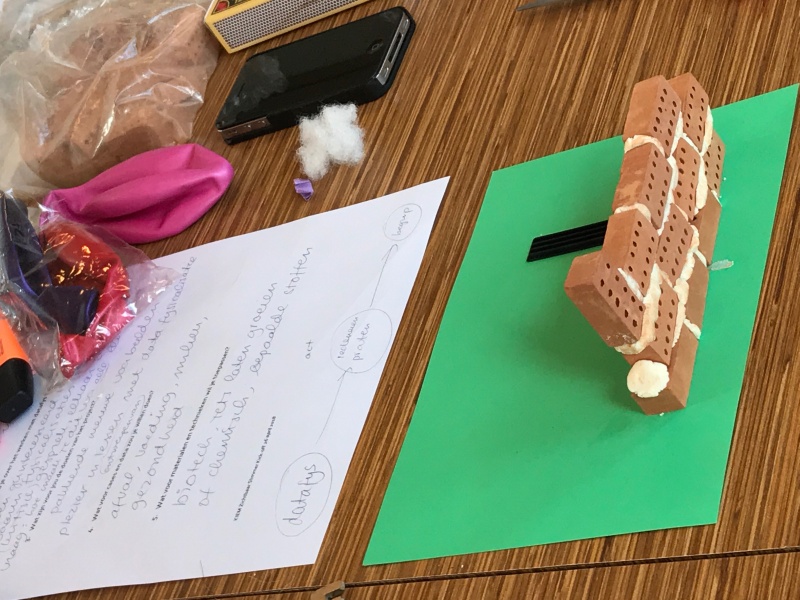
 One participant made a rapid physicalisation of a toolbox for data physicalisation that should also think “outside the box”.
What questions do you have concerning the use of data phys in class?
On top of the questions already detailed in the proposal, this is a selection of questions that were formulated during the kick-off:
- In which ways can you make data more accessible and intuitive?
- What should be the level of complexity?
“Every model has its constrictions”
- How to make dataphys useful and meaningful, to all students/pupils?
- How to enable students (or ‘users’ of a datavis product) to physicalize data for themselves? (Or is that too complicated?)
- Which handles are needed?
- How to do this in a way that supports critical thinking, communication and the generation of new insights? And also generate creativity, aesthetic pleasure and joy?
- How to measure the effects of dataphysicalisation in class?
- To which extent do physicalisations lead to (critical) conversation, common discussion,…?

What are the goals of the datahpysicalisation project?
Some of the important goals of the project that were expressed in writing, and further elaborated in the dataphysicalisation exercise were:
- Creating a bigger platform
- Enabling the target group (children, students) to do as much as possible themselves
- Explore the potential of dataphys: Finding best practices and appealing examples
- VISIBILITY: Make the invisible visible (e.g. air pollution)


- Make it physical
- Make it interactive (realtime interaction by means of connected sensors)
- Make dataphys purposeful and relevant

“Currently there are a lot of packages in which data is just loaded and visualized. In this process, there is NOT ENOUGH critical thinking. With the deployment of the dataphys ‘technique ‘ my hope is to create more added value“
- Find fun, beauty and new understanding in the process
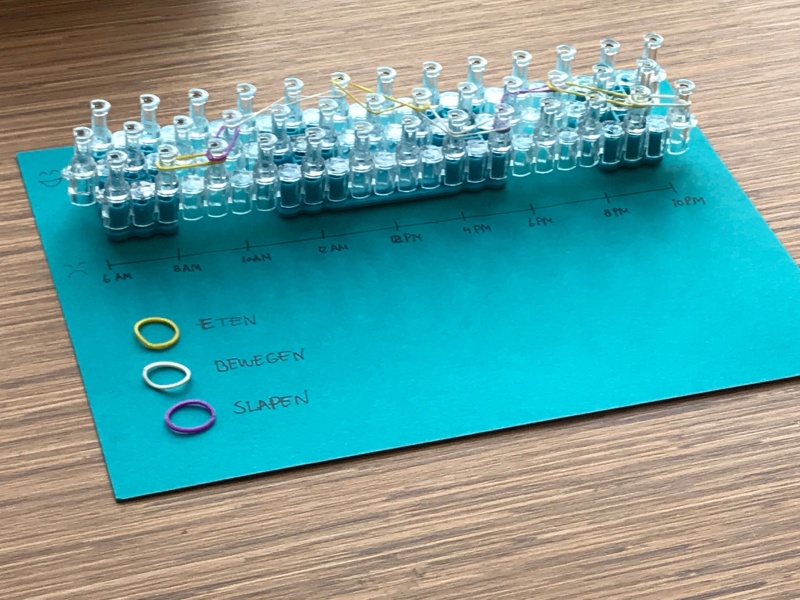
- Using dataphys for saving rhythms and detecting patterns
- Gain understanding of how to deploy dataphysicalisation in education
- Develop a dataphys format for the classroom
Lessons learned and future directions
When looking at the expressed questions and goals, one of the biggest challenge is to make dataphys relevant and purposeful. Although it is hard to quantify, the short physicalisation exercise in which the people involved reflected and discussed their artefacts each afterwards, turned out to be a rather unexpected easy, fun and valuable way to support and enrich common thinking and discussion. The physical results show that writing, making and discussing dataphys are different vehicles for expression and vehicles that can complement each other.
- Make data physicalisation BIG and interactive (?)
- Explore data in the bigger sense > the physicalisation of stories
- Data physicalisation should not be the end goal, but the beginning; it should enable space for meaningful thinking, discussion and understanding.
To be continued!